Labor Data Turmoil
What Happened — Labor market data released on Friday sent the stock market lower. The unemployment rate held fairly steady, however, payroll data tracking the number of workers indicated some weakness. It was enough of a departure from the expected that President Trump accused the Depart of Labor Statistics of partisanship and called for its Commissioner to be fired. We’re taking a closer look at what’s happening.
Why It Matters — More people out-of-work and having trouble finding new employment, does not bode well for the health of the economy.
- Even more troubling is that recent data has shown inflation has struggled to get down to desired levels and even ticked higher last month. The condition of simultaneous high inflation and high unemployment is called stagflation, which is especially dreaded because policies to address either condition tends to exacerbate the other.
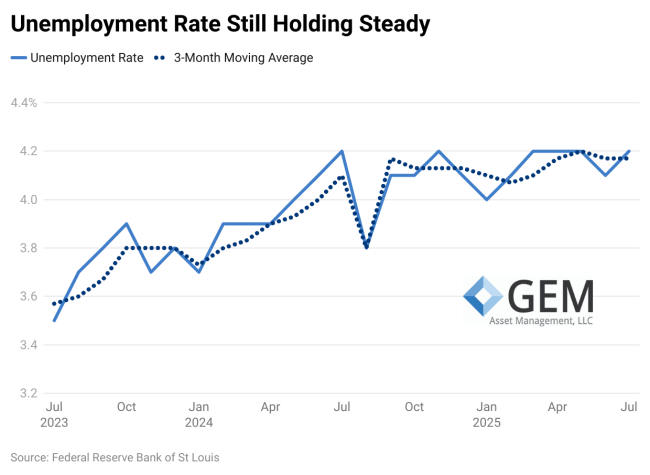
Unemployment Rate — The rate for July held steady at 4.2%. For nearly all of the past twelve months, the unemployment rate has fluctuated between 4.0% and 4.2%. Although looking closely at this month’s rate, the actual number was 4.248%, which just barely round down to 4.2%.
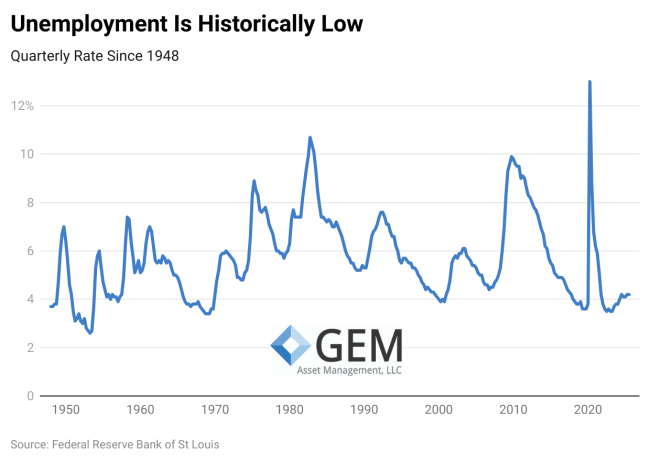
The Bigger Picture — There will always be some frictional unemployment where people are between jobs. Even if the rate ticks a bit higher, historically we are in a period of strength in the labor market.
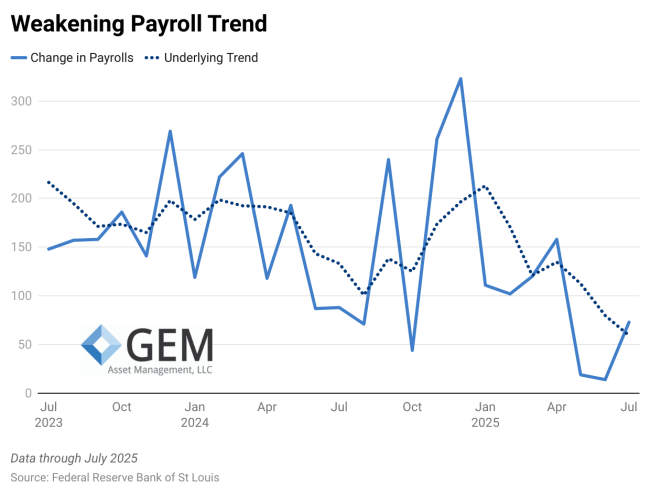
Dramatic Payroll Revisions — Some 73,000 new jobs were created last month, which was a bit below expectations. We had heard whispers there may some some revisions coming and that is what seems to be producing the drama. May and June payroll counts were revised lower by 258,000.
Notable Trend — Payroll data is notoriously volatile month-to-month which is why we use a smoothing calculation to identify the underlying trend. 2024 was especially turbulent with strikes, hurricanes and fires disrupting work. However, with the recent revisions a clear trend showing weaker payroll growth has become evident.
Why the Difference? — It would seem like the Unemployment Rate and the number of payrolls should track relatively closely. The difference is that the data comes from two different surveys.
- The unemployment rate surveys known households for how many working-age members have a job or are actively looking.
- The payroll data come from an establishment survey asking how many people are currently on the payroll.
Immigration Impact — Households that have been recently established are less likely to be included in the survey tracking the unemployment rate. However, those working individuals would be picked up in the survey of establishments. As the federal government has taken steps to enforce immigration laws, the numbers of foreign born workers has declined. This drop has been partially offset by an increase in the numbers of native born workers and a decrease in the participation rate. This has kept the unemployment rate low while payrolls seem to be withering.
Bottom Line — Payroll numbers rebounded hard after the economy emerged from Covid. An influx of immigrant workers helped meet the pent-up demand. The added labor supply moderated wage growth and kept it from further fueling already hot inflation. As the economy has cooled, firms are no longer adding huge numbers of workers, but they aren’t laying off large numbers either. The economy is pretty close to full employment, we just need the labor market to stay in balance to prevent a fall-off in consumer demand.
The market sees the labor data as raising the odds of an interest rate cut at the next Federal Reserve meeting in September. We would also note that the OBBB Act recently passed by Congress (and discussed last week) on balance should provide some fiscal stimulus to the economy. We do not think the economy is currently in a bad place and do not expect the sky to begin falling soon.


